

Understanding Network Dynamics in Technology Adoption#
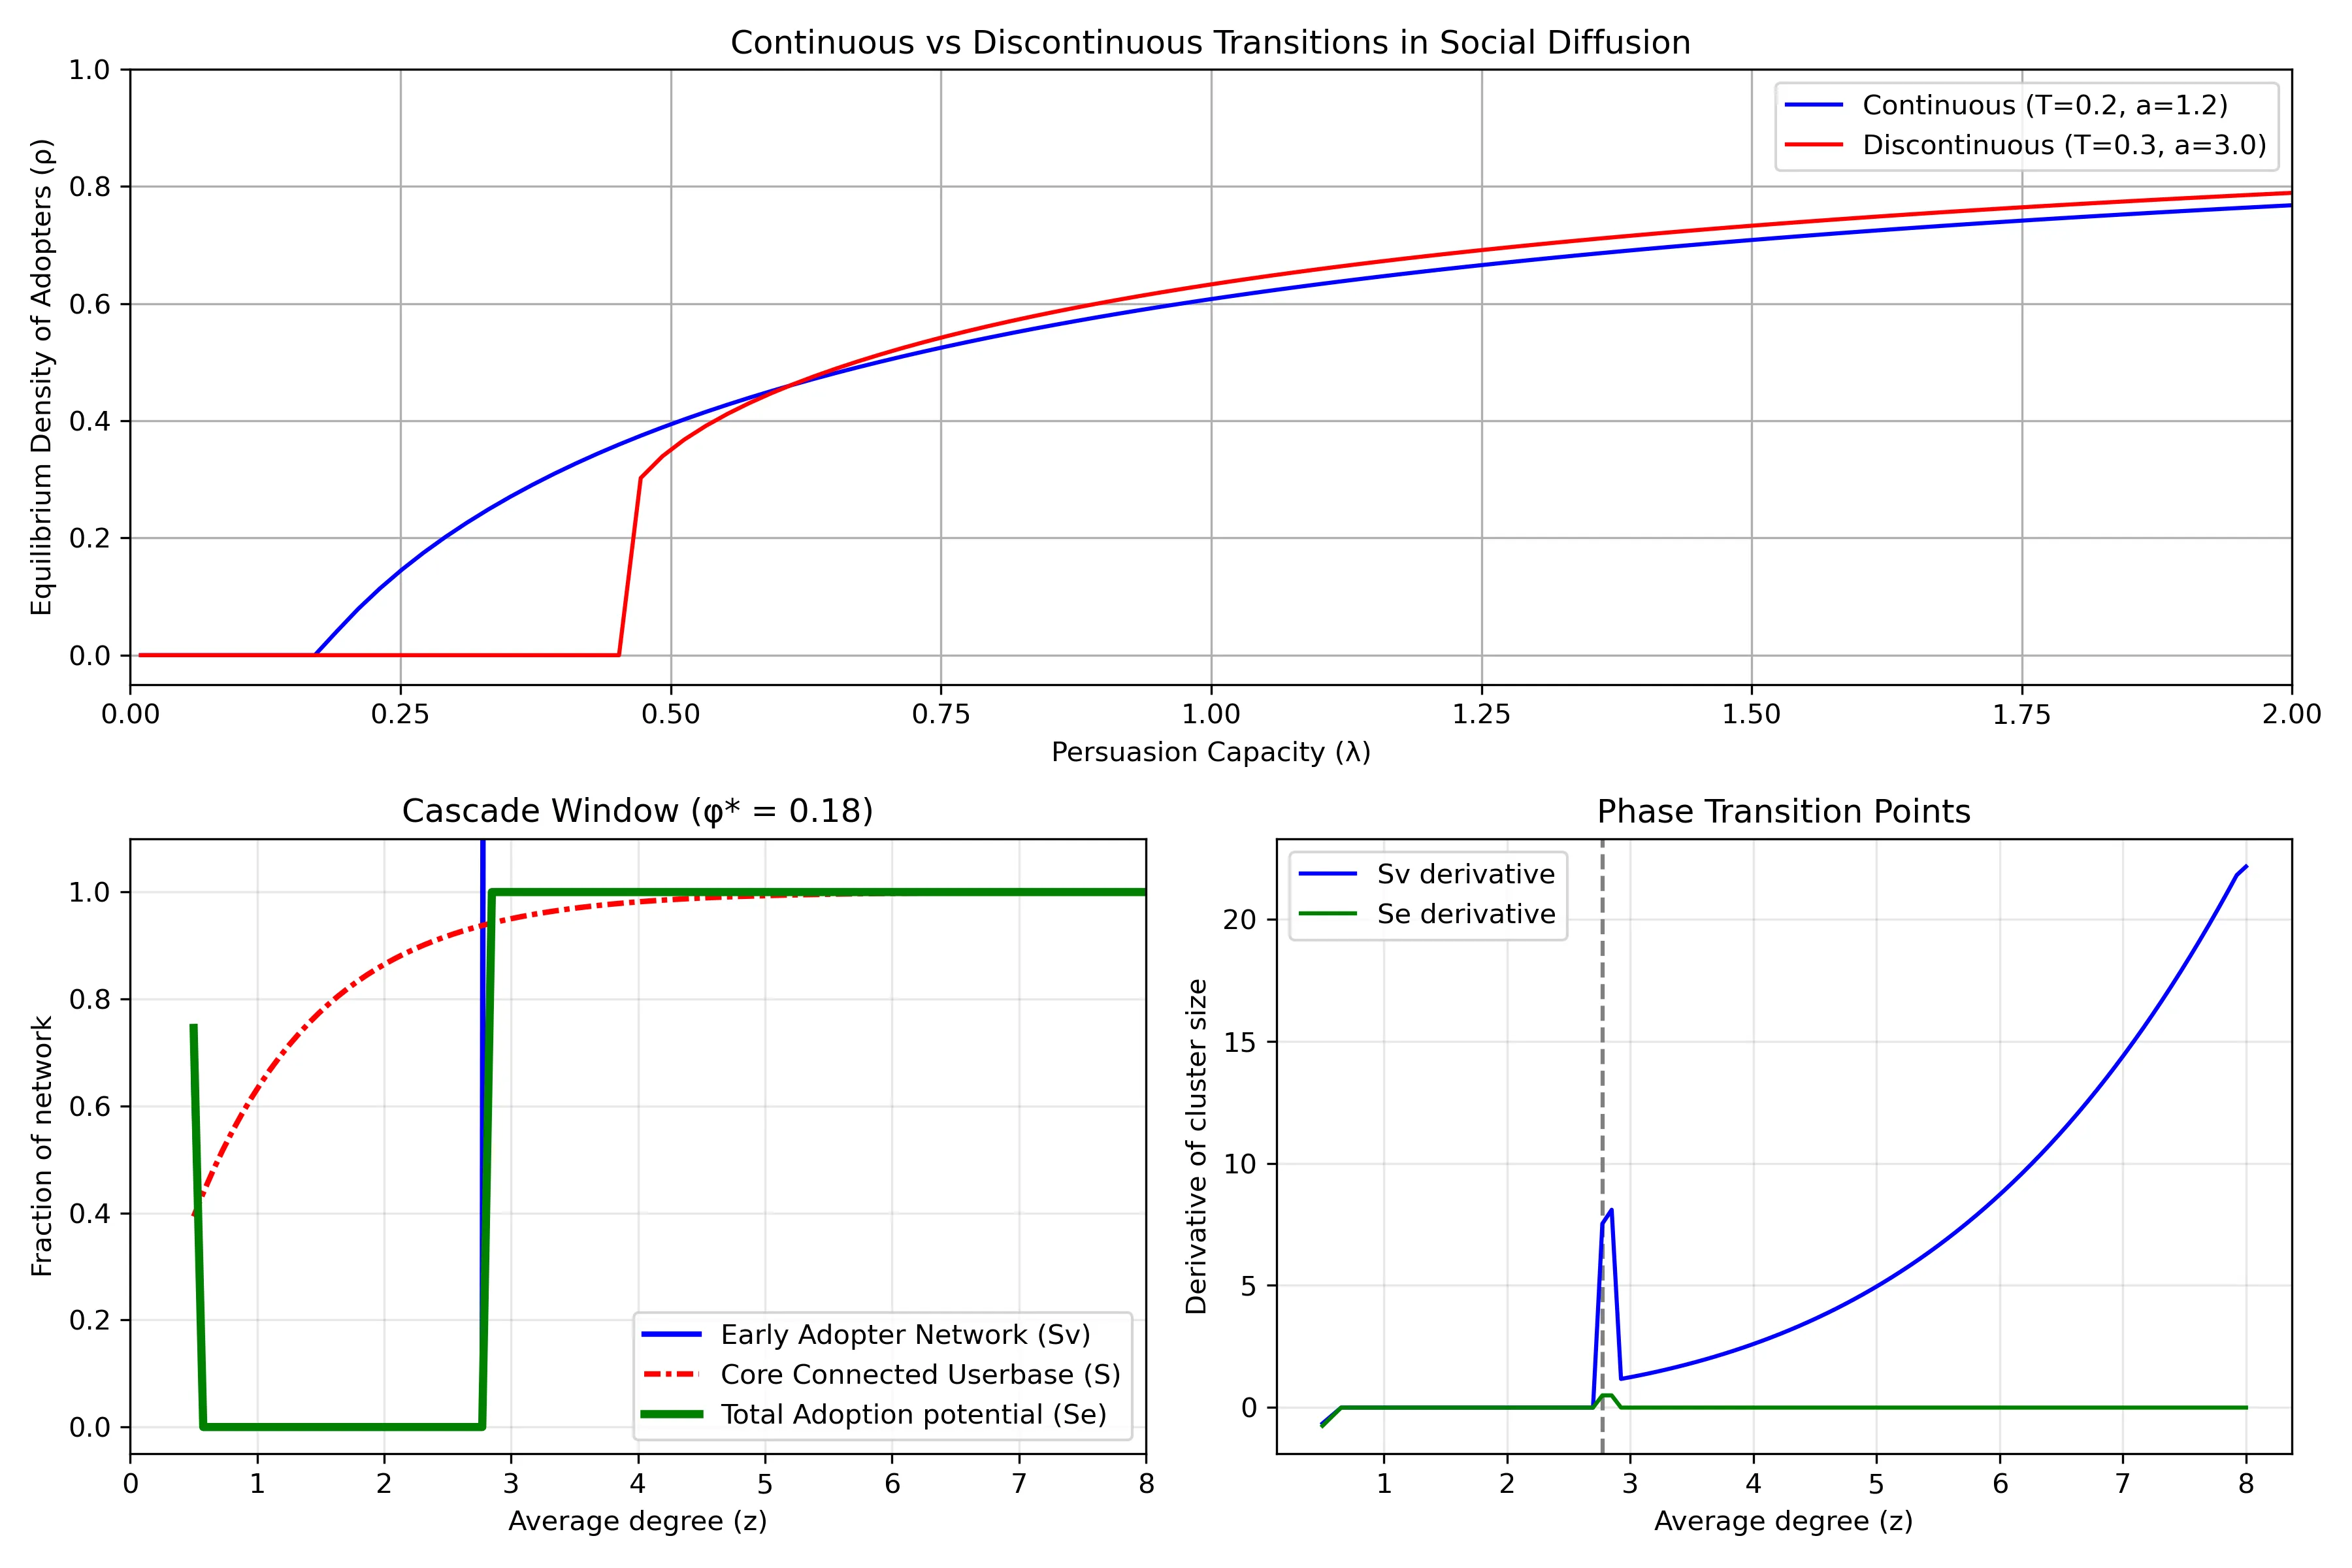
- Top Row: Continuous vs Discontinuous Transitions in Social Diffusion
- Shows two different ways that innovations spread through a population. The horizontal axis (
λ) represents "persuasion capacity" - how effectively adopters convince others to join. The vertical axis (ρ) shows what fraction of the population eventually adopts. - Blue line shows a continuous transition: as persuasion capacity increases, adoption grows gradually and smoothly. Example: streaming services that steadily gains users year after year.
- Red line shows a discontinuous transition (or "tipping point"): adoption remains near zero until reaching a critical threshold, then suddenly jumps to a high level. This represents technologies that spread explosively once they reach a critical mass.
- The different curves emerge from the situations of how people make adoption decisions. When there is higher adoption resistance (higher threshold
Tand steeper response curvea), discontinuous transitions become more likely.
Bottom Left: Cascade Window#
When is widespread adoption possible? Its based on network structure. The horizontal axis (z) represents network connectivity - on average, how many connections does an individual have?
The plot has a regime "cascade window" - widespread adoption only occurs within a specific range of connectivity:
- If connectivity is too low (left side), the network is too fragmented for innovations to spread widely
- If connectivity is too high (right side), people become resistant to change because they need many of their connections to adopt before they will follow suit
The different curves show theoretical predictions for:#
- The early adopter network (blue solid): people who can be convinced to adopt with minimal influence.
- The core connected userbase (red line): the largest interconnected population in the network
- Total adoption potential (green line): the potential total reach possible through both early adopters and those they influence
Bottom Right: Phase Transition Points#
This plot highlights critical thresholds where the system undergoes dramatic changes. The peaks represent points where small changes in network connectivity cause the largest shifts in adoption patterns.
The vertical dashed line marks a critical connectivity value where adoption dynamics fundamentally change. Near these critical points, the network becomes especially sensitive - like how a small price drop might suddenly make a product accessible to a much larger market segment, increasing how easily individuals are connected.
The green line (total adoption potential rate) shows only a brief spike at the critical threshold and then quickly returns to zero. Implying that the total potential reach of an innovation changes only at that specific critical point and then stabilizes. This is why timing market entry is so crucial - there's a narrow window where network conditions can suddenly enable widespread adoption, and missing this window means the technology might never achieve its full potential.
Further Reading:#
- Malcom Gladwell's Tipping Point
Comments0
No comments yet. Start the conversation.